Let’s first look at the results of different investment tools in 2023 I have selected commodities, crypto currencies and some interesting stocks for comparison.
| Comparison | 4-Jan-23 | 4-Jan-24 | % Change | MAX | MIN | %Max/Min |
|---|---|---|---|---|---|---|
| S&P 500 | 3,808.0 | 4,688.0 | 23.1% | 4,750.0 | 3,800.0 | 25.0% |
| Nasdaq NAS 100 | 10,741.0 | 16,282.0 | 51.6% | 16,900.0 | 10,741.0 | 57.3% |
| Dow jones US30 | 33,270.0 | 37,440.0 | 12.5% | 37,500.0 | 31,800.0 | 17.9% |
| Nikkei 225 | 25,820.0 | 33,377.0 | 29.3% | 33,377.0 | 25,820.0 | 29.3% |
| Dax | 14,436.0 | 16,505.0 | 14.3% | 17,000.0 | 14,700.0 | 15.6% |
| gold | 1,831.0 | 2,040.0 | 11.4% | 2,080.0 | 1,800.0 | 15.6% |
| Crude | 72.5 | 72.5 | 0.0% | 94.5 | 66.3 | 42.5% |
| GBPUSD | 1.2 | 1.3 | 6.6% | 1.3 | 1.2 | 10.8% |
| EURUSD | 1.1 | 1.1 | 3.7% | 1.1 | 1.0 | 7.9% |
| IWM | 174.3 | 193.7 | 11.1% | 205.1 | 162.5 | 26.2% |
| TLT | 101.8 | 97.1 | -4.6% | 108.1 | 82.4 | 31.1% |
| USDTRY | 18.8 | 29.7 | 58.3% | 29.7 | 18.8 | 58.3% |
| EURTRY | 19.8 | 32.8 | 65.9% | 32.8 | 19.8 | 65.9% |
| GBPTRY | 22.5 | 38.0 | 68.9% | 38.0 | 22.5 | 68.9% |
| BTCUSD | 16,780.0 | 45,350.0 | 170.3% | 45,350.0 | 16,780.0 | 170.3% |
| ETHUSD | 1,244.0 | 2,222.0 | 78.6% | 2,423.0 | 1,244.0 | 94.8% |
| NVDA | 147.0 | 494.0 | 236.1% | 503.0 | 147.0 | 242.2% |
| MSFT | 224.0 | 371.0 | 65.6% | 382.0 | 224.0 | 70.5% |
| SAP | 99.5 | 137.3 | 37.9% | 148.0 | 99.5 | 48.7% |
| Oracle | 84.0 | 102.0 | 21.4% | 126.0 | 84.0 | 50.0% |
| SalesForce | 137.0 | 252.0 | 83.9% | 267.0 | 137.0 | 94.9% |
| MicroStrategy | 160.0 | 641.0 | 300.6% | 677.0 | 160.0 | 323.1% |
| Apple | 126.5 | 182.0 | 43.9% | 198.0 | 126.5 | 56.5% |
| Coinbase | 34.0 | 153.0 | 350.0% | 186.0 | 36.0 | 416.7% |
| Carvana | 4.0 | 47.3 | 1082.5% | 60.0 | 4.0 | 1400.0% |
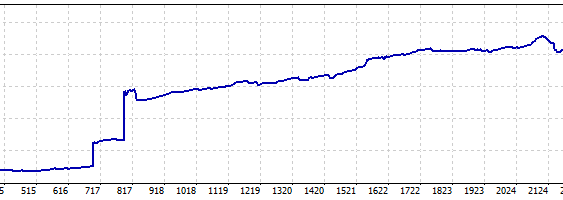
The table below represents the summary of all trades of 2023. All values are either ratios or In Euro currency.
https://ugurcandan.com/wp-content/uploads/2024/01/DetailedStatement2023.xlsx All transactions listed.
| Summary: | All Currencies are Euro | ||
|---|---|---|---|
| Deposit/Withdrawal: | 3000.00 | Credit Facility: | 0.00 |
| ClosedTrade P/L: | 2966.52 | Floating P/L: | -8.40 |
| Balance: | 7485.24 | Equity: | 7476.84 |
| Margin: | 58.17 | ||
| FreeMargin: | 7418.67 | ||
| Details: | |||
| Gross Profit: | 8482.08 | Gross Loss: | 5515.56 |
| Total Net Profit: | 2966.52 | ||
| Profit Factor: | 1.54 | Expected Payoff: | 1.23 |
| Absolute Drawdown: | 253.94 | Maximal Drawdown: | 697.36 (17.65%) |
| Relative Drawdown: | 26.99% (478.51) | ||
| Total Trades: | 2,421.00 | ||
| Profit Trades (% of total): | 1702 (70.30%) | Loss trades (% of total): | 719 (29.70%) |
| Long Positions (won %): | 756 (70.63%) | Short Positions (won %): | 1665 (70.15%) |
| Largest profit trade: | 74.61 | Largest loss trade: | -79.61 |
| Average Profit trade: | 4.98 | Average loss trade: | -7.67 |
| Max consecutive wins ($): | 48 (378.15) | Max consecutive losses ($): | 37 (-610.77) |
| Maximal consecutive profit (count): | 378.15 (48) | Max consecutive loss (count): | -610.77 (37) |
| Average consecutive wins: | 5.00 | consecutive losses: | 2.00 |


