Traveling salesman problem:
Wikipedia: “The travelling salesman problem (TSP) asks the following question: Given a list of cities and the distances between each pair of cities, what is the shortest possible route that visits each city exactly once and returns to the origin city? It is an NP-hard problem in combinatorial optimization, important in operations research and theoretical computer science.”
In the mathematics literature, it appears that the first mention of the TSP was made by Karl Menger, who described a variant of the problem in notes from a mathematics colloquium held in Vienna on February 5, 1930
A rough translation of Menger’s problem from the German original is the following.
”We use the term Botenproblem (because this question is faced in practice by every postman, and by the way also by many travelers) for the task, given a finite number of points with known pairwise distances, to find the shortest path connecting the points.”
The Famous Problem – WATCHMEN
In the early 1960s, plotting a tour through the United States was in the public eye owing to an advertising campaign featuring a 33-city TSP. The original ad from Procter & Gamble is reproduced in Figure 1.9. The $10,000 prize for the shortest
tour was huge at the time, enough to purchase a new house in many parts of the
country. The proposed drivers of the tour were Toody and Muldoon, the police heroes of the Car 54, Where Are You? television series. Although the duty of
these two officers did not actually go beyond the boundaries of New York’s Bronx
borough, police and night watchmen must often walk or drive tours in their daily
work.

The large prize money in the Procter & Gamble contest caught the attention of applied mathematicians; several papers on finding TSP tours cite this particular example. In fact, one of the winners of the contest was the TSP researcher Gerald Thompson of Carnegie Mellon University. Thompson coauthored a paper with R. L. Karg in 1964 that reports the optimal tour displayed in Figure 1.10. It should be noted that Thompson did not know for sure that he had the shortest tour; there is a difference between finding a good tour and producing a convincing argument that there is no tour of lesser cost.
In a conversation Professor Thompson pointed out that a number of contestants, including himself, had submitted the identical tour. The tiebreaker for the contest asked for a short essay on one of Procter & Gamble’s products, and we are happy to report that Thompson came through as a prize winner.
The ART Side
Tools and links
http://mrl.nyu.edu/~ajsecord/stipples.html
Adrian Secord
Says ”I was a PhD student at the Media Research Laboratory and Vision, Learning and Graphics Group in Computer Science Department of New York University. I am now working at Google New York.” and his tools and functions that drive the TSP solution in digital art.
Stippling, or, a Voronoi Stippler
I’ve been teaching computers to stipple. It’s fun stuff.
Stippling: The production of continuous graduations of light and shade through the use of small, discrete dots or strokes. In painting the technique is more commonly called pointillism.
New! You can now download executables and source code.
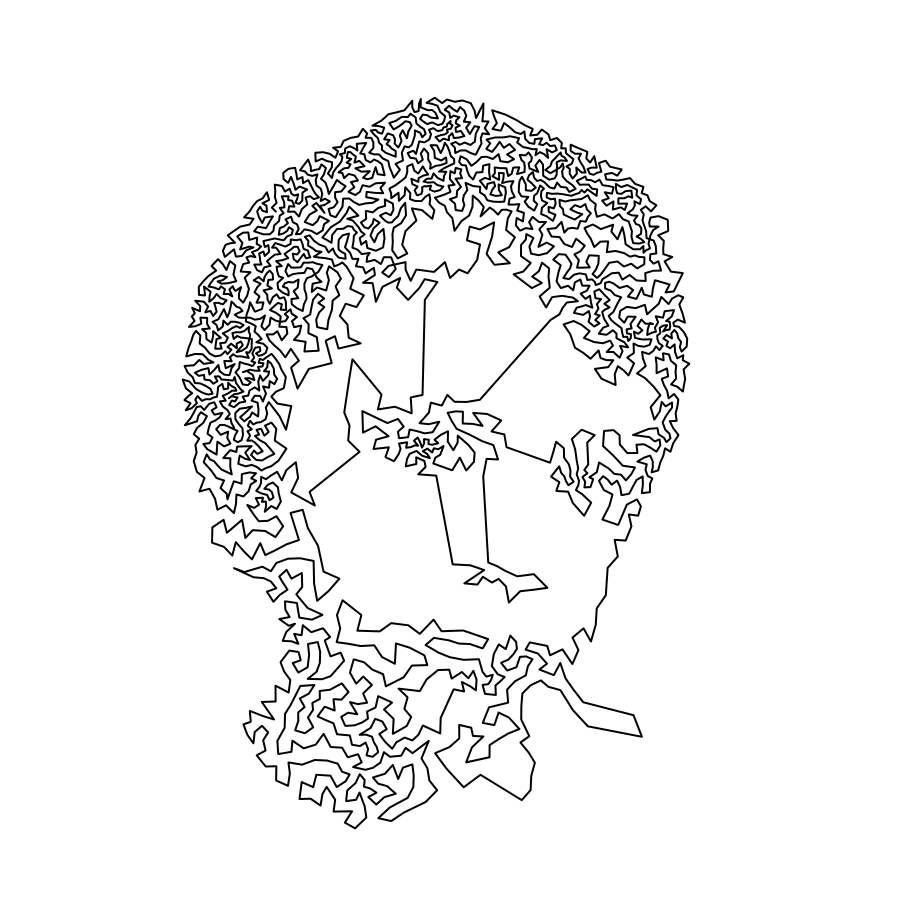
History of “CONTINUOUS LINE DRAWINGS”
From: http://press.princeton.edu/chapters/s8451.pdf “Robert Bosch and Adrianne Herman (2004) had the interesting idea to use geometric TSPs as a means for creating continuous line drawings of images. In such a drawing the pencil or pen should never leave the paper as the line is being created. Tracing out a tour will of course give a drawing of this form, but the trick is to find a layout of cities so that the tour gives a good reproduction. To accomplish this, Bosch and Herman make a digital version of the image they would like to draw, using a gray-scale scanning device. The cities are then placed with density corresponding to the various shades of gray in the digital document. More precisely, they divide the image into a grid and place between 0 and k cities at random locations in each grid cell, depending on the average level of gray in the cell, where 0 is nearly white and k is nearly black. The value of k and the size of the grid control the number of cities in the resulting TSP.

The technique for placing the cities was refined by Kaplan and Bosch [303], using an algorithm developed by Secord. In this approach the tone of the image is used as a density fuction to build a weighted Voronoi diagram, that is, a partition of the space into regions such that all points in region i have city i as their nearest neighbor. In computing the nearest neighbor, the density function is used to weight the geometric distance, so that dark Voronoi regions will tend to be maller
than light regions. In an iteration of Secord’s placement algorithm, the cities are
replaced by the centers of the regions and a new diagram is computed.
Bosch and Kaplan used the above methodology to create the drawings of the
Mona Lisa and the Colosseum given in Figure 1.30. The Mona Lisa TSP has 10,000 cities and the Colosseum TSP has 11,999 cities. In each case the drawn tour was computed with Concorde, using a heuristic search module (the tours are most likely not optimal).”
Final Software Link
http://wiki.evilmadscientist.com/StippleGen
I should give credit to evilmadscientist for the ease of use and software pieces created. I am using PolarGraph DIY V plotter to plot my continues TSP lines. You can see my art work below.
Enyoy !