


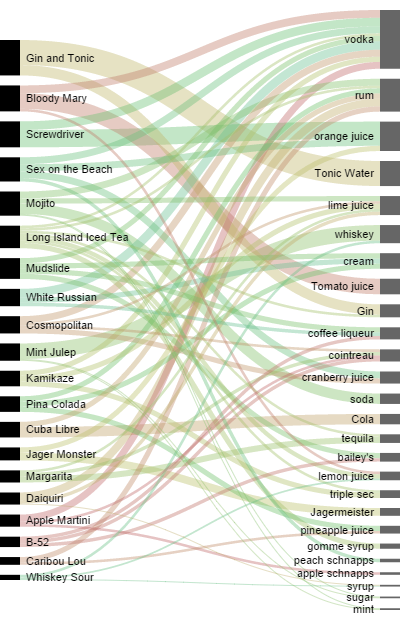
As You might imagine I really like sites like http://d3js.org/ But usually d3 is more a developer code base rather than the end user friendly visualization gadget. I recently found out this web site http://app.raw.densitydesign.org/ much user friendy and in minutes you can create next generation graphs like the one below. Just took me a few minutes
Lets see how it looks. It shows how the music industry transformed into a new era. It is a SVG file visualised.
1,9801,9851,9901,9952,0002,0052,010DVD Audio8-trackSubscriptionSACDMusic videoMobileLP/EPKioskDownload SingleDownload Music VideoDownload AlbumCD singleCDCassete singleCassetevinyl single